Levelised cost of hydrogen: cost drivers, sensitivities and modelling practice for green hydrogen projects
last updated
October 15, 2026
Why do published LCOH figures differ so much?
Two LCOH figures can both be correct and still differ by several dollars. They may use different boundaries, power prices, utilisation, capital costs or dollar years. DOE shows the effect. DOE's May 2024 record for proton exchange membrane (PEM) electrolysis gives USD 4.40 to 8.20 per kilogram across four US power scenarios and three capital cost cases. The figures are in 2022 dollars, untaxed and unsubsidised, and exclude compression, storage, distribution and dispensing (DOE Hydrogen Program Record 24005).
The table below shows the DOE results at its baseline installed cost of USD 2,000 per kilowatt (kW):
Power scenario
Capacity factor
Power price (US cents per kWh)
LCOH (USD per kg, 2022 dollars)
Grid (US industrial average)
97%
8.3
7.50
Hydropower
50%
3.4
6.70
Land-based wind (Class 1)
51%
2.9
6.40
Hybrid wind and solar
74%
3.3
5.20
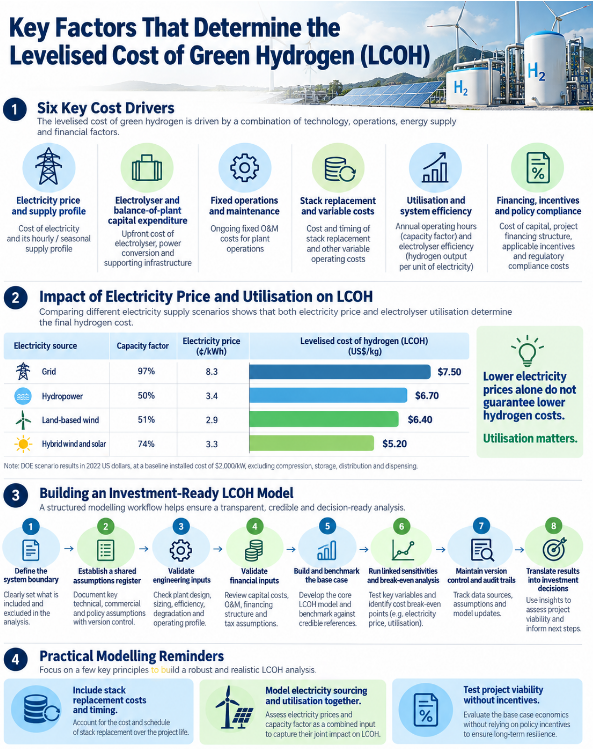
Read the table for the link between inputs as well as the totals. Hydropower power costs 3.4 cents per kilowatt-hour, close to the 3.3 cents of the hybrid case, yet LCOH is USD 1.50 higher because the plant runs at a 50% capacity factor instead of 74% (DOE Record 24005). A low power price does not give a low LCOH without high utilisation.
The International Renewable Energy Agency (IRENA) says renewable electricity is the largest single cost of on-site green hydrogen production (IRENA, Green hydrogen cost reduction, 2020). The International Energy Agency (IEA) Levelised Cost of Hydrogen Maps pick the cheapest mix of solar, wind, electrolyser size and flexibility from hourly capacity factors. A model built on annual average power prices gives a cost that a variable-power plant will not see.
What does LCOH measure, and what does it leave out?
LCOH spreads all lifetime costs over all lifetime hydrogen output, usually with discounted cash flow. It works like the levelised cost of electricity (LCOE), with one extra step: converting electricity use into kilograms of hydrogen. DOE's example assumes system electricity use of 57.5 kilowatt-hours per kilogram (DOE Record 24005).
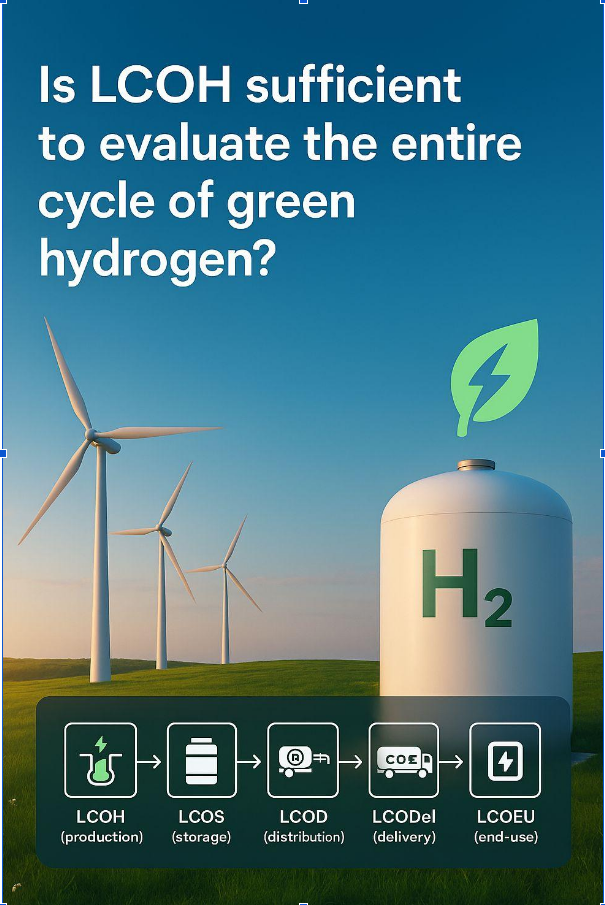
Label the boundary on every figure. Plant-gate LCOH covers production up to the plant boundary. Delivered cost adds compression, storage, transport and dispensing, and DOE's record excludes all four. Ask four questions of any figure: is it plant gate, does it include compression and to what pressure, does it include storage, and does it include dispensing? Without those answers, comparisons are not valid. For delivery costs, see evACAD's guide to Hydrogen Economy 2.0.
Which cost drivers move LCOH most?
Give each driver an owner. That turns the driver tree from an analysis tool into a governance tool. Use the table below as the starting list:
IRENA: largest single cost for on-site production. At DOE's 57.5 kWh per kg and a 3.3 cent price, electricity costs about USD 1.90 per kg (our arithmetic)
Electrolyser and balance-of-plant capital cost
Stack, power electronics, water treatment, compression, storage, integration
Engineering and the construction contractor
DOE baseline is about USD 2,000 per kW installed, with a range of 1,500 to 2,500. In the hybrid case LCOH rises from 4.40 to 6.00 across that range (DOE Record 24005)
Fixed operations and maintenance
Maintenance contracts, staffing, insurance, spare parts
Operator and finance
DOE assumes 5% of installed capital a year, excluding stack replacement
Variable costs and stack replacement
Deionised water, consumables, stack replacement schedule and cost
Engineering and operator
DOE assumes replacement every 40,000 hours at 11% of installed capital, about 15% of direct capital
Utilisation and performance
Full-load hours, system efficiency in kWh per kg, part-load losses, degradation
Engineering
DOE capacity factors from 50% to 97% produce the spread in the first table
Financing and incentives
Cost of capital, tax, depreciation, grants, production incentives
Finance and policy
The US 45V credit is USD 0.60 to 3.00 per kg when wage and apprenticeship rules are met (26 U.S.C. 45V)
Stack replacement: plan the timing as well as the cost
DOE assumes a 40,000-hour stack life and a replacement cost of 11% of total installed capital, which DOE notes is about 15% of direct capital (DOE Record 24005). IRENA's 2020 table lists PEM stack lifetimes of 50,000 to 80,000 hours and alkaline lifetimes of 60,000 hours (IRENA, 2020).
Do the arithmetic for your own operating profile. These are illustrative examples that use DOE's 40,000-hour stack life:
Example at 4,000 full-load hours a year: a 40,000-hour stack lasts ten years, so a 20-year plant needs one replacement, in year ten.
Example at 8,000 full-load hours a year: the stack lasts five years, so replacements fall in years 5, 10 and 15.
Example with an 80,000-hour stack at 4,000 hours a year: no replacement falls inside 20 years.
Replace published averages with vendor guarantees, and test the cost range.
How do you run sensitivities that match real projects?
A common mistake is to change one input by a fixed percentage and hold the rest fixed. It looks tidy and tells you little, because inputs move together. Cheap power is often variable, which cuts utilisation. A cheaper electrolyser may degrade faster. The cheapest power source may fail the rules for production incentives.
Test linked scenarios instead. The table below gives six examples. The hour ranges are illustrative, so replace them with your project data:
Scenario
Electricity sourcing
Utilisation
Question it answers
Base case
Dedicated renewable supply at the contracted tariff
Medium (3,500 to 4,500 hours a year)
What is the defensible starting LCOH?
High utilisation
Hybrid renewables with grid backup or battery
High (5,000 to 6,000 hours a year)
How much capital cost per kilogram does extra utilisation remove?
Low power price
Opportunistic spot or curtailed power
Variable
What happens to eligibility and revenue if cheap power is not renewable or not additional?
Policy stress
Strict compliance with the certification boundary
Medium to low
Does the cheapest power design stay eligible for incentives?
Execution cost stress
Base-case power, higher capital cost and contingency
Medium
Is the project still investable at realistic construction cost?
Financing stress
Base case, higher cost of capital, no incentive
Medium
What is the LCOH without support, and does the project still work?
Run the financing stress case without incentives, because many projects depend on support. India pays production incentives under its Strategic Interventions for Green Hydrogen Transition (SIGHT) programme, awarded by tender (Press Information Bureau, PIB, 3 July 2024). The European Hydrogen Bank pays a fixed premium in euro per kilogram, awarded by auction (European Commission). As of October 2026, the US 45V credit applies only to facilities that begin construction before 1 January 2028 (26 U.S.C. 45V). The IEA says Indian offtake deals depend on incentives that remain unclear (Global Hydrogen Review 2026). A model that has not been run without incentives shows only whether the project works under today's policy.
What does a modelling workflow that survives investment review look like?
A bankable LCOH model is a chain of assumptions from engineering to finance to commercial, with sign-off at each link. The workflow below is built to survive review by a lender's independent technical advisor, which is often the toughest check before the final investment decision (FID). It has eight steps:
Step
Action
Output
Sign-off
1
Define the system boundary: plant gate or delivered; include or exclude compression
Boundary document
Engineering and commercial
2
Create the shared assumptions register with owners and version control
Locked register v1.0
Cross-functional integration review
3
Engineering input pack: kWh per kg at rated and part load, plant scope, utilisation profile, degradation curve, stack replacement schedule
Engineering input sheet
Lead engineer
4
Finance input pack: cost of capital, tax, depreciation, incentive eligibility, debt and equity structure
Finance input sheet
Finance lead
5
Build the base-case model and cross-check it against published benchmarks
Base-case model
Independent sense check
6
Run linked scenarios and find the break-even point for each main driver
Sensitivity matrix and break-even analysis
Investment committee review
7
Apply model governance: version control, change log, sign-off on any input that moves committee outputs
Governance protocol
Version-controlled repository with audit trail
8
Turn outputs into decisions: redesign if capital cost dominates; renegotiate power if electricity dominates; design for compliance if policy drives eligibility
Decision memo
Stage-gate go or no-go
Benchmark your model against published references
Use two kinds of reference. First, DOE Record 24005 gives full inputs for one electrolyser case (stack life, replacement cost, installed cost, power price, capacity factor), so you can test your cost structure line by line. Second, the IEA's archived maps show how hourly solar and wind data shape cost-optimal design. Their 2030 base case assumes an electrolysis capital cost of USD 620 to 960 per kilowatt, far below the DOE baseline of about USD 2,000 per kilowatt installed. The two figures may not cover the same scope, so compare the definitions before you compare the results (IEA Levelised Cost of Hydrogen Maps; DOE Record 24005).
Neither source replaces a project model. If your result is far below a published benchmark, find the assumption doing the work and test whether it would survive review.
What are the most expensive LCOH modelling mistakes?
Using annual average electricity prices without testing the hourly profile for utilisation and oversizing.
Comparing LCOH across projects or publications that use different boundaries, especially on compression.
Treating incentive eligibility as a late question. Rules under India's SIGHT scheme, EU renewable fuels of non-biological origin (RFNBO) electricity sourcing and US 45V decide which power designs qualify, so they shape the design from day one.
Leaving out stack replacement, or using a placeholder with no vendor estimate and no replacement schedule.
Running one most-likely case with no linked sensitivities, which gives a point estimate that a lender cannot bound.
Governance practices worth adopting
A locked assumptions register that engineering, finance and policy review together, not by email.
A cost breakdown that separates electricity, capital cost, fixed operations and maintenance, variable costs and financing.
Version control and a change log for any input change that affects figures shown to the investment committee or lenders.
A label on every LCOH output: plant gate or delivered; with or without incentives; base or stress case.
How do you turn LCOH into project decisions?
A cost model that does not lead to decisions is a reporting exercise. Use the largest cost line to choose the action:
If electricity is the largest cost line, work on power procurement. Look for a cheaper power purchase agreement that still meets certification rules, or a hybrid design with battery flexibility that adds utilisation.
If capital cost is the largest cost line, work on scale and standardisation, or on utilisation. More utilisation may mean taking grid power during renewable shortfalls, subject to eligibility rules.
If policy drives viability, design for compliance. Fix the boundary, scope the metering for monitoring, reporting and verification in front-end engineering design, and meet the power sourcing rules from day one.
Takeaways
Model electricity price and utilisation together. DOE's own scenarios show that a low power price alone does not give a low LCOH.
Include the whole balance of plant and a dated stack replacement schedule.
Treat incentive rules as design inputs, and always run a no-incentive case.
Keep an assumptions register, version control and a label on every output.
Be careful with cost forecasts. The IEA expects low-emissions hydrogen to stay costlier than fossil hydrogen in most regions, with China the exception, where low-emissions hydrogen could become cost-competitive by 2030 (Global Hydrogen Review 2026). IRENA's 2020 analysis said green hydrogen could fall below USD 2 per kilogram and below USD 1 per kilogram before 2040 under an aggressive deployment pathway of 5 terawatts by 2050 (IRENA, 2020). Treat such forecasts as scenarios, not as inputs to a bankable model.
Build your green hydrogen expertise
Understand the technologies, economics and applications shaping the green hydrogen industry with evACAD's Advanced Green Hydrogen Master Program, delivered with Umagine.
LCOH is the lifetime cost per kilogram of hydrogen. It spreads capital cost, operating cost, stack replacement and financing cost over all hydrogen produced, using a consistent discounted cash flow method.
Which inputs most strongly affect LCOH?
Electricity price and profile, installed capital cost, utilisation, operating cost including stack replacement, and financing and incentive terms. Electricity and utilisation move together, so model both with hourly data.
Why does electrolyser utilisation change LCOH so much?
At low utilisation the plant makes less hydrogen while capital charges, fixed operating costs and insurance stay the same, so cost per kilogram rises. In DOE's scenarios, hydropower at 3.4 cents and a 50% capacity factor gives USD 6.70 per kg, while hybrid power at 3.3 cents and 74% gives USD 5.20 per kg.
What is the difference between plant-gate LCOH and delivered cost?
Plant-gate LCOH covers production up to the plant boundary. Delivered cost adds compression, storage, transport and dispensing. DOE's production cost record excludes those steps, so never compare a plant-gate figure with a delivered one.
What model governance practices make LCOH outputs investable?
Use a shared assumptions register with cross-functional sign-off, a transparent cost breakdown, version control with a change log, a label on every output, and linked sensitivities instead of single-variable tests.